Role of song and plumage colouration in species interaction
TinkerBird Project – 2024
Kube Yini
Introduction
Many animals use visual and auditory signals as a means of communication (Garcia & Favaro, 2017; Osorio & Vorobyev, 2008; Rosenthal & Ryan, 2000; Slabbekoorn & Smith, 2002). Visual and auditory signals such as song and plumage function in species recognition, territory defence, mate attraction, sexual selection and assessment of individual fitness (Delhey et al., 2017; Krebs et al., 1978; McGraw & Hill, 2000; Schmidt et al., 2007). The importance of these forms of communication goes beyond individual interactions, they also contribute to shaping the structure and dynamics of the entire community of animals(Badyaev et al., 2002; Mason et al., 2014; Santos et al., 2011). Many studies use these traits as models to understand their influence in shaping animal communication and enhancement in maintaining species boundaries (Kirschel et al., 2009; Mason & Bowie, 2020).
Birds may communicate through different vocal signals that include songs – often longer and more complex sounds used in territory defence and mate choice and calls – typically shorter simple sounds used in close proximity to receivers for contact purposes, alarm, and mobbing (Catchpole & Slater, 2003; Mason et al., 2017). Most passerines learn their song from the parental forms. However, some groups of birds such as non-oscines develop their song innately (ten Cate, 2021).
Visual signals, on the other hand, such as carotenoid-based plumage, serve multiple functions in sexual selection, particularly in species where visual cues are essential for mate recognition and attraction (Isaksson et al., 2007; Pike, 2017; Simons et al., 2014). In many birds, males exhibit elaborate and vibrant plumage which facilitates mate choice. Birds acquire carotenoids from their diet and displayed their colourful pigments in feathers and skin (Hill et al., 2023; Saks, McGraw, et al., 2003). These colours serve as an indicator of health (Saks, Ots, et al., 2003) and genetic quality (Lopes et al., 2016), as only birds with access to abundant, carotenoid-rich foods and good overall health can develop bright and vivid hues(Blount et al., 2003; Lozano, 1994). It is dietary yellow carotenoids that can be deposited onto integuments, but some taxa can convert these dietary carotenoids to ketocarotenoids through the action of an enzyme encoded by the gene CYP2J19 (Kirschel et al., 2020; Mundy et al., 2016; Twyman et al., 2018). Given that carotenoid-based colouration could potentially convey information about individual quality, it has often been assumed that yellow through red carotenoid-based colours might have a signalling function (Delhey et al., 2023; Hill, 2002; Willink & Wu, 2023).
Both bird song and feather colours derived from carotenoid pigments are strongly influenced by their environment(Brumm & Naguib, 2009; Parker, 1996; Slabbekoorn & Smith, 2002; Weaver et al., 2018). For instance, the vibrancy of colours is directly influenced by the availability of food resources, particularly those high in carotenoids (Y. Zhang et al., 2017). Therefore, a habitat with abundant nutrients creates an avenue for developing vivid colours, enhancing their attractiveness and signalling effect (Cooney et al., 2022). Similarly, bird song is hypothesised to be shaped by the environment. One mechanism widely supported is the acoustic adaptation hypothesis – which posits that acoustic signals in densely vegetated habitats tend to be more tonal and at lower frequencies, with a slower pace and simpler structure while in open habitats birds are expected to sing at higher frequencies (Ey & Fischer, 2009; Giuseppe Boncoraglio & Saino, 2007). In addition to the environment, bird song is predicted to be shaped by morphology (Derryberry et al., 2018). Specifically, larger birds have longer vocal tracts and therefore produce songs of lower frequency while birds with short vocal tracts produce higher frequency vocalisations (Hoese et al., 2000; Nowicki, 1987; Podos et al., 1995; Riede et al., 2006; Suthers & Zollinger, 2004). Avian body size and proportions are predicted to vary along an environmental gradient in accordance with Bergmann’s rule, one of the ecogeographic principles. This rule suggests that homeothermic animals within species and related species tend to have larger body sizes in colder climates at higher latitudes, while smaller body sizes are typical in warmer climates (Ashton, 2002; Salewski & Watt, 2017; Sebastianelli et al., 2022; Teplitsky et al., 2008). Nevertheless, studies performed to examine the effects of ecological factors on song and plumage colouration have produced equivocal results (Ballentine, 2006; Derryberry et al., 2018; Mikula et al., 2021).
Red-fronted and yellow-fronted tinkerbird are African barbets (Family: Lybiidae, Order: Piciformes) (Short & Horne, 2001) in which primarily males emit simple stereotypic songs that are genetically based (Kirschel et al., 2009; Sebastianelli et al., 2024) and differ in two vocal characters, frequency and pace (Nwankwo et al., 2018; Sebastianelli et al., 2024). Their range spans sub-Saharan Africa with red-fronted tinkerbird having a disjunct distribution in East and Southern Africa (Short & Horne, 2001). In Southern Africa, the two species have been documented to hybridise where their ranges overlap in north-eastern Eswatin i(Nwankwo et al., 2019) . Their common names reflect the carotenoid-based forecrown colour which is due to the deposition of dietary carotenoids and converted carotenoids respectively (Kirschel et al., 2020). The extent of hybridisation between them provides an opportunity to investigate the factors that may mediate a pattern of asymmetric assortative mating found between the two species(Sebastianelli et al., 2024). To what extent do song and carotenoid-based plumage character differences play in mediating reproductive isolation between the two species? Is there a preference for the fast-pace song of red-fronted tinkerbird over the slow-pace song of yellow-fronted tinkerbird? Or is there a preference for the red forecrown of red-fronted tinkerbird which is a result of conversion of dietary carotenoids to keto-carotenoids? If there is preference of either fast song and or the red colour, we expect that this could drive assortative mating among the two species, thus, promoting introgression of the alleles of red-fronted tinkerbird into yellow-fronted tinkerbird.
Also, to what extent do geographic and ecological factors shape song variation in yellow-fronted and red-fronted tinkerbird? Since the two species occupy different habitats, yellow-fronted tinkerbird mostly occurs in drier woodland savannah, while red-fronted tinkerbird prefers coastal and evergreen habitats (Short & Horne, 2001). Similarly, much plumage colouration can vary across landscapes, and it remains unclear to which extent, in addition to genetics, variation in carotenoid-based colour variation is governed by variations of carotenoid-rich diet across tinkerbirds environments.
To answer these questions, we conducted two independent studies. We investigated relative recognition of red-fronted and yellow-fronted tinkerbird song and plumage by conducting playback experiments with models. We included taxidermic mounts of the two species and 3D models (painted to resemble each species). Secondly, we examined the effect of genetic and ecological factors on song frequency to infer potential relationships between these factors and song frequency in red-fronted and yellow-fronted tinkerbird. Here, we report on the findings from the two independent studies and discuss further studies we aim to conduct going forward.
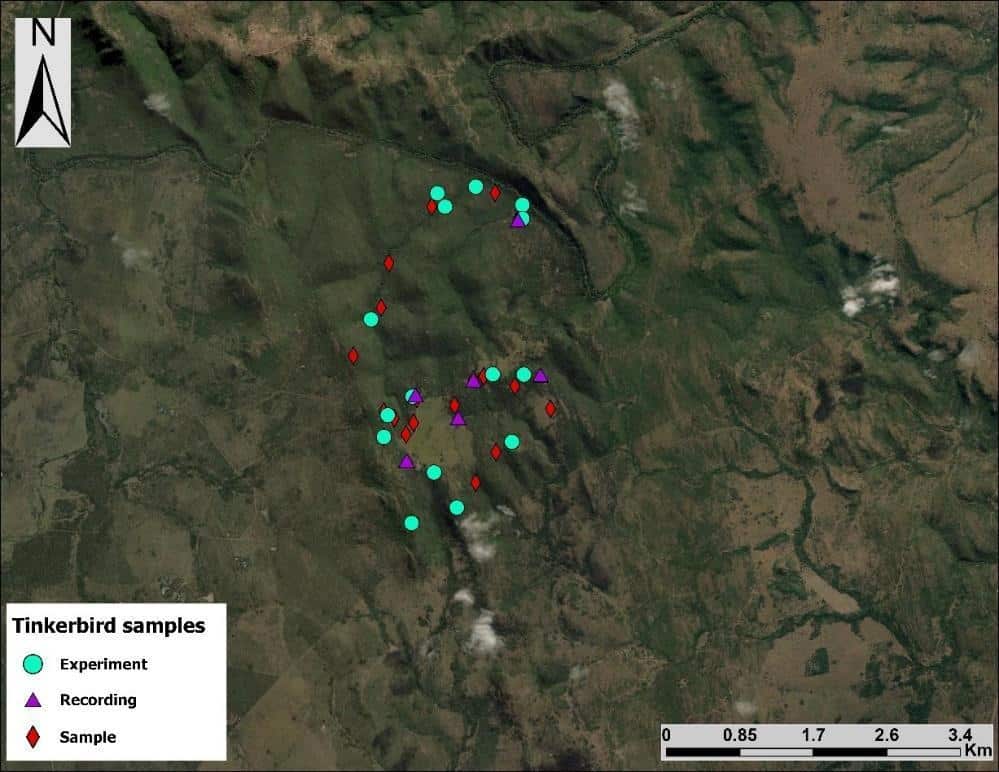
Figure 1: Samples and recordings of ringed and colour-ringed birds in Kube Yini. Also, shown are the playback experiments that were conducted.
INDEPENDENT PROJECTS
The role of song and plumage colouration on tinkerbird interactions at a local scale
We investigated whether yellow-fronted (YFT) or red-fronted tinkerbird (RFT) responded more strongly to conspecific or heterospecific song by conducting playback experiments in allopatric populations of YFT and RFT or the contact zone of the two species. Further, we tested whether the responding bird interacted more with the red-fronted (model with red forecrown) or yellow-fronted (model with yellow forecrown) tinkerbird model. We used alternatives of 3D printed models which avoid potential issues of pseudoreplication, but also taxidermic mount models that provided the added opportunity to replicate the air sac inflation of tinkerbirds when they sing. Something we achieved by manually inflating a balloon inserted inside the model and pumping it in synchrony with song playback. Both types of models were mounted onto servo motors that rotated the models side to side at a tempo equivalent to natural movement of tinkerbirds when they sing. The experiments were performed by first locating a singing bird in its territory. We then mounted the models on two tripods 3m apart on either side of the speaker – mounted on a tripod placed between the two models. We also mounted on a tripod a Canon EOSR7 camera for documenting the behaviour of the focal bird alongside audio recording and observer notes. For each experiment we alternated playing a synthetic playback of YFT and RFT for 10 minutes. After 10 minutes had elapsed, we observed the focal bird’s behaviour for a further minute. During the playback we recorded the a) latency to respond – the time taken for the focal bird to approach the playback experiment arena, b) time spent within 20 m of the experiment arena, and c) the closest approach distance within 20m of the experiment.
We first tested for differences in responses to the two songs in sympatry and allopatry, by fitting generalised linear mixed models using the glmmTMB package in R. We used closest approach distance, latency to approach and time spent within 20m, as a response in the models and playback (YFT or RFT), population (as a categorical factor consisting of RFT allopatry, YFT allopatry and the contact zone), and the interaction between them as fixed factors. Location nested in the subject territory of the focal bird and experiment number was entered as a random effect.
To test our second hypothesis that RFT will selectively respond strongly to its own song and interact only with RFT 3D model or RFT taxidermy, we fitted GLMMs using the closest distance to the model or speaker as a response variable, where the distance from either model or speaker is no more than 1.5m. The interaction of the focal bird and playback was entered as fixed effects. Model 1 (RFT model) and model 2 (YFT model) were entered as crossed random factors. We also tested the time spent with the speaker or the model by fitting a model that included the interaction of the focal bird and playback as fixed effects and model 1 and model 2 and location were entered as crossed random effect.
Samples and recordings obtained from Kube Yini
Since 2015, we have collected 29 blood and feather samples of red-fronted tinkerbird from Kube Yini Private Game Reserve. These include nine samples collected in December 2023. Apart from the samples, we recorded 23 songs, 12 of which from colour-ringed birds. Some samples have been sequenced using ddRAD sequencing and some with whole genome resequencing.
Results
Playback experiments
We conducted playback experiments in South Africa and Eswatini from 28th November 2023 to 19th December 2023. We conducted a total of 56 playback experiments, 26 of these were conducted in the allopatric population of yellow-fronted tinkerbird, 18 were conducted in the allopatric population of red-fronted tinkerbird (Kube Yini) and 13 experiments were performed in the contact zone

Figure 2: Playback experiment set-up. Two tripods with models mounted on top and one tripod in the middle where the speaker was placed.
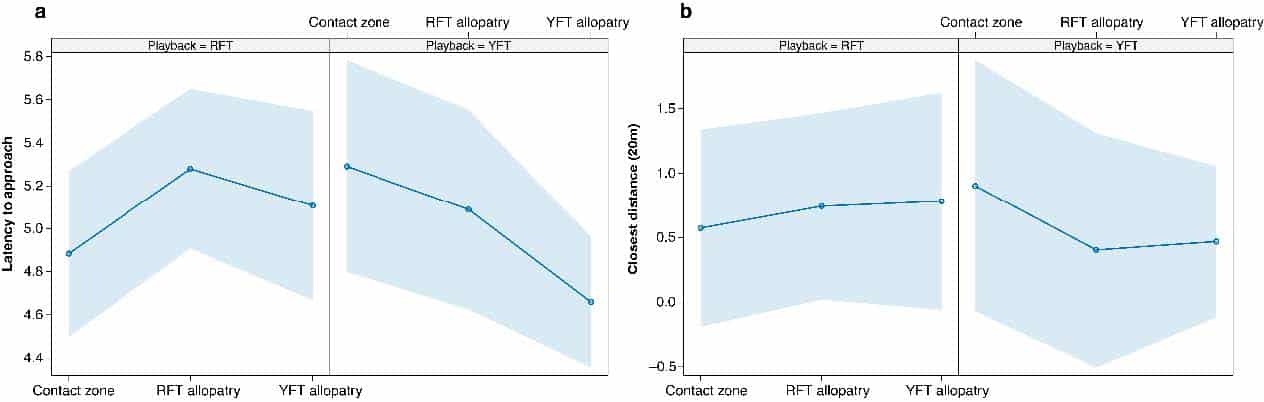
Fig 3: Boxplots showing the response of red-fronted and yellow-fronted tinkerbird to conspecific and heterospecific song in the contact zone and allopatric populations.
Response to song of yellow-fronted and red-fronted tinkerbird
In the models where latency to approach was used as a response variable, there were no differences in responses to the two playbacks or among the populations, but there was a significant interaction effect, in that responses to the two playbacks in the contact zone were significantly different to in the allopatric YFT population (Figure 3a, Table 1). The significant interaction suggests that when we use YFT playback, responses are significantly slower in the contact zone compared with RFT playback, than they are to the two species in the YFT allopatry population. For the closest distance, the models shows that there is a significant interaction in that hybrids responded significantly less to YFT song than to RFT song compared to how RFT responds to YFT song (Figure 3b, Table 1).

Figure 3: Plots showing the model effects of playback and population on a) latency to approach and b) closest distance within 20m of the experiment set-up. Also depicted is the effect of the interaction between population and playback used.
Table 1: Generalised linear mixed model output showing the effects of focal bird and population as well their interaction on the response (measured as latency to approach and closest distance within 20m) of red-fronted (RFT) and yellow-fronted tinkerbird (YFT). P-values in bold indicate statistically significant effects.
| Latency to approach | Closest distance (within 20m) | |||||||
| Predictors | Estimates | SE | z-value | p-value | Estimates | SE | z-value | p-value |
| Intercept | 4.88 | 0.19 | 25.24 | <0.001 | 0.57 | 0.38 | 1.50 | 0.135 |
| Playback [YFT] | 0.41 | 0.31 | 1.30 | 0.194 | 0.33 | 0.62 | 0.53 | 0.597 |
| Population [RFT allopatry] |
0.40 | 0.27 | 1.47 | 0.141 | 0.17 | 0.53 | 0.32 | 0.748 |
| Population [YFT allopatry] |
0.22 | 0.29 | 0.76 | 0.446 | 0.21 | 0.57 | 0.37 | 0.715 |
| Playback [YFT] × Population [RFT allopatry] |
-0.60 | 0.43 | -1.38 | 0.167 | -0.67 | 0.85 | -0.78 | 0.433 |
| Playback [YFT] × Population [YFT allopatry] |
-0.86 | 0.41 | -2.07 | 0.038 | -0.64 | 0.81 | -0.80 | 0.426 |
Role of song and plumage on tinkerbirds interaction
Model (plumage) versus speaker (song)
RFT approaches the model more to RFT playback and the speaker more to YFT playback (Table 2, Figure 4a-b). YFT does not differentiate between model and speaker in response to either playback, but there is an interaction effect in that the difference between closest distances between RFT and YFT playbacks differs significantly from that difference in RFT. YFT also spends significantly less time within 1.5m of the experimental setup than RFT does.
Red-fronted model versus yellow-fronted model
Red-fronted tinkerbird differentiates between the two playbacks and responds significantly differently to them, approaching the red-fronted model to RFT playback and the yellow-fronted model to YFT playback (Table 2, Figure 4c-d). Yellow-fronted tinkerbird did not respond differently to the two models in response to either playback.

Figure 4: The role of song on the interaction of red-fronted and yellow-fronted tinkerbird measured as the a) time spent or b) closest distance to the speaker or the models used. The plots show the effects of the interaction between playback and the focal bird on the response of the focal bird. Also shown is the role of plumage colouration on the interaction of the two species measured as the c) time spent or d) closest distance by the bird to either the red-fronted or yellow-fronted tinkerbird model. Negative values of time spent, and closest distance depict time spent and closest distance to yellow-fronted tinkerbird while positive depict time spent and closest distance to red-fronted tinkerbird.
Table 2: GLMM outputs showing the effect of focal bird and playback on the closest distance to the speaker or model and the time spent with either the speaker or model of a bird responding during the experiment. For closest approach, negative effect represents closer to the speaker, positive closer to the model. For time spent, negative effects represent more time with the speaker, positive more with the model. P-values in bold indicate statistically significant effects.
| Closest distance | Time spent | |||||||
| Predictors | Estimates | SE | z-value | p-value | Estimates | SE | z-value | p-value |
| Intercept | 0.04 | 0.35 | 0.13 | 0.900 | 24.75 | 17.11 | 1.45 | 0.148 |
| Focal bird [YFT] | 1.08 | 0.60 | 1.79 | 0.073 | -68.75 | 29.63 | -2.32 | 0.020 |
| Playback [YFT] | 1.55 | 0.53 | 2.91 | 0.004 | -46.75 | 26.14 | -1.79 | 0.074 |
| Focal bird [YFT] × Playback [YFT] |
-1.79 | 0.77 | -2.34 | 0.019 | 57.49 | 37.61 | 1.53 | 0.126 |
Table 3: GLMM outputs showing the effect of focal bird and playback on the closest distance and time spent closer to the red-fronted or yellow-fronted tinkerbird model during the experiment. Positive values indicate closer to / more time with YFT model and negative to RFT model. P-values in bold indicate statistically significant effects.
| Closest distance | Time spent | |||||||
| Predictors | Estimates | SE | z-value | p-value | Estimates | SE | z-value | p-value |
| Intercept | -0.64 | 0.64 | -1.00 | 0.315 | 7.38 | 28.51 | 0.26 | 0.796 |
| Focal bird [YFT] | 0.25 | 0.92 | 0.27 | 0.788 | -50.88 | 49.38 | -1.03 | 0.303 |
| Playback [YFT] | 1.33 | 0.63 | 2.13 | 0.033 | 5.96 | 43.54 | 0.14 | 0.891 |
| Focal bird [YFT] × Playback [YFT] |
-1.09 | 0.90 | -1.20 | 0.230 | 48.67 | 62.67 | 0.78 | 0.437 |
Discussion
In this study we aimed to determine the extent to which yellow-fronted and red-fronted tinkerbirds distinguish between the plumage coloration and song of each species. The results of our experiments suggest red-fronted tinkerbird song elicits stronger responses in the contact zone, the only location where both species can be heard side by side, and RFT responds more appropriately to its own song, approaching the red-fronted model more closely than to either the speaker or the yellow-fronted model, while yellow-fronted tinkerbirds did not respond differently to the visual stimuli in either playback treatment.
Our findings also suggests that red-fronted tinkerbirds better distinguish the characteristics of yellow-fronted and red-fronted tinkerbird songs. According to Sebastianelli et al. (2024), female red-fronted tinkerbirds prefer to mate assortatively with male red-fronted tinkerbirds, whereas female yellow-fronted tinkerbirds females mate with red-fronted, yellow-fronted and even hybrid males (Sebastianelli et al., 2024).
Analysis of experiments using red-fronted and yellow-fronted models showed that red-fronted tinkerbirds interacted closely with the red forecrown model when exposed to red-fronted tinkerbird song. When exposed to yellow-fronted tinkerbird stimuli, red-fronted tinkerbirds interacted more with the yellow forecrown model, while the yellow-fronted tinkerbirds did not differentiate between the yellow or red forecrown, regardless of the playback used. The differentiated interaction of red-fronted tinkerbirds with the models suggests that song plays a major role in the interaction of the two species.
Environmental factors, body mass, and ancestry shape song frequency in red-fronted and yellow-fronted tinkerbird
In the second study, we examined the effect of ecological and genetic factors on song frequency in red-fronted and yellow-fronted tinkerbird. We utilized 384 song recordings of 165 ringed birds obtained during fieldwork (2015-2023) across a contact zone in Southern Africa between yellow-fronted and red-fronted tinkerbird (Fig. 5) and tested two long-standing hypotheses of factors influencing song frequency in animals: the acoustic adaptation hypothesis (AAH) and the morphological constraint hypothesis (MCH). The AAH suggests that the acoustic signals of animals, especially those used for communication, are adapted to the transmission properties of the habitat in which they are produced and received in. Therefore, environmental factors such as vegetation density and structure influence the evolution of these signals to enhance their effectiveness in a given habitat. As such, birds in forests might use lower-pitched, slower songs that penetrate foliage better, while birds in open areas might use higher-pitched, faster songs less affected by wind and open space. Because red-fronted tinkerbird occupies coastal forests and more riparian-like habitats while yellow-fronted tinkerbird occurs in more open dry woodland savanna, we expected red-fronted tinkerbird to sing at lower frequencies than yellow-fronted tinkerbird. The MCH, instead posits that in birds, body size and beak size and shape necessarily constrain song frequency characteristics.

Figure 5: a) Distribution of red-fronted and yellow-fronted tinkerbird across sub-Saharan Africa. Insert showing the range of the two species in Southern Africa and where they overlap in Eswatini. b) Spectrograms of red-fronted, hybrid and yellow-fronted tinkerbird song.
In previous work we performed at a continental scale, we showed that body size differs along an elevational and latitudinal scale, with larger birds at higher elevation and latitude, and that patterns of song frequency mirrored this finding, with lower frequencies higher up and closer to the poles (Sebastianelli et al., 2022). We also found some limited support for an effect of the AAH at that scale. The study was based on independent data sets, however, and no study has investigated the direct and indirect effects of the environment on song frequency, including via its effect on morphology. Furthermore, our work across the tinkerbird contact zone in Southern Africa has identified the genetic basis of vocal rhythm. It is not known to what extent song frequency may have a genetic basis as well. Here, we aimed to determine the relative effects of the environment and ancestry on song frequency, their direct effects and their indirect effects via their contribution to morphological differences in body size and beak size.
Environmental variables
To factor in environmental conditions at the capture locations, we obtained data on enhanced vegetation index (EVI), leaf area index (LAI), and percentage tree cover (VCF) from the Moderate-Resolution Imaging Spectroradiometer (MODIS) for each year and location where the birds were recorded. EVI quantifies vegetation greenness, LAI describes plant canopy structure, and VCF represents the percentage of tree cover. Additionally, data on bioclimatic variables including mean annual temperature (BIO1), annual rainfall (BIO12), and humidity were sourced from WorldClim, an online database providing climatic data from 1970 to 2000 (Fick & Hijmans, 2017). The environmental data were extracted in ArcGIS using the “extract values to points” function in the statistical analysis tool.
Inferring genomic ancestry
We collected samples from individuals and then extracted DNA for whole genome resequencing and ddRAD seq. We then used fastStructure (Raj, Stephens, and Pritchard 2014) (Purcell et al. 2007)to infer ancestry, setting the number of populations to K=2 (Nwankwo et al., 2019).
Effects of environmental and genetic factors on song
We used a structural equation model (SEM) (Grace, 2006) to investigate the direct and indirect effects of ancestry, morphology (beak size and body size), and environmental factors (EVI, LAI, VCF, absolute latitude, rainfall, temperature, humidity) on song frequency in yellow-fronted and red-fronted tinkerbirds. We used the SEM to partition the correlations between the exogenous explanatory variables and endogenous response variables into direct and indirect effects using a path analysis (Grace 2006).
We first log-transformed the song frequency because it is better represented on a logarithmic scale (Sebastianelli et al., 2022). Then, we fitted a model to infer the direct effects of LAI, EVI, VCF, temperature, rainfall, humidity, ancestry, body mass, and beak size. In the same model, we also looked at the indirect effects of ancestry, rainfall, temperature, and humidity on body mass, and whether body size would affect song frequency. We also considered the possibility that the size of the beak could constrain song frequency (sensu (Podos, 2001)), so we fitted a model to examine the indirect effects of mass, temperature, EVI, LAI, and VCF on beak size. We assessed the fit of our model using a χ2 goodness-of-fit test of the difference between the observed data and hypothesized model, the root mean square error of approximation (RMSEA) and the comparative fit index (CFI). A satisfactory model fit was indicated by: (1) a non-significant χ2 goodness-of-fit test (α=0.05), (2) CFI > 0.9, and (3) lower 90% confidence intervals (CIs) of RMSEA < 0.05 (X. Zhang & Savalei, 2016).

Figure 6: Scatter plots showing the relationship between song frequency (in log scale) and a) body mass, b) ancestry and c) humidity.
Results
There were both direct and indirect effects of the environmental and genetic factors on tinkerbird song frequency (Fig 6). Body size, beak size, and environmental factors all contributed to variation in song frequency. In particular, there was a striking negative effect of body mass on song frequency (β= -0.015, P(>|z|) = < 0.001) (Table 4), suggesting that larger birds sing at lower frequencies. Furthermore, there was a statistically significant negative effect of ancestry on song frequency (β= -0.035, P(>|z|) = 0.002) (Table 4), indicating that birds with more red-fronted tinkerbird ancestry sing at lower frequencies, but there was no relationship between ancestry and body mass (β= -0.326, P(>|z|) = 0.161) (Table 4).
There was also a negative direct effect of EVI, a measure of greenness, on song frequency (β= -0.008, P(>|z|) = 0.006) (Table 4), suggesting that birds in open habitats sing at higher frequencies compared to those in densely forested areas. There was a positive relationship between song frequency and humidity (β= 0.041, P(>|z|) = 0.003) (Table 4), indicating that birds sing at higher frequencies in more humid areas. Conversely, temperature had a negative statistically significant effect on body mass (β= -0.015, P(>|z|) = 0.002) (Table 4). There were no direct effects of LAI, VCF, temperature, rainfall, and beak size on song frequency, but with the effect of temperature on body mass, an indirect effect of temperature on song frequency was revealed (Table 4). Body mass also positively affected beak length, but beak length did not affect song frequency.
Table 4: Direct and indirect effects of ecological and genetic factors on song frequency in yellow-fronted and red-fronted tinkerbird. Statistical significant effects are shown with bold p-values.
| Regressions: | Predictor variables | ||||
| Estimate | SE | z-value | P(>|z|) | ||
| Song frequency~ | |||||
| EVI | -0.008 | 0.003 | -2.762 | 0.006 | |
| LAI | 0.004 | 0.003 | 1.421 | 0.155 | |
| VCF | -0.004 | 0.004 | -1.006 | 0.314 | |
| Body mass | -0.015 | 0.004 | -4.117 | <0.001 | |
| Ancestry | -0.035 | 0.011 | -3.092 | 0.002 | |
| Temperature | -0.007 | 0.012 | -0.529 | 0.597 | |
| Humidity | 0.041 | 0.014 | 3.006 | 0.003 | |
| Rainfall | <0.001 | 0.005 | 0.07 | 0.944 | |
| beak length | 0.005 | 0.003 | 1.387 | 0.165 | |
| beak length~ | |||||
| Body mass | 0.19 | 0.076 | 2.494 | 0.013 | |
| Temperature | -0.102 | 0.078 | -1.307 | 0.191 | |
| EVI | 0.048 | 0.065 | 0.745 | 0.456 | |
| VCF | -0.043 | 0.07 | -0.611 | 0.541 | |
| LAI | -0.094 | 0.064 | -1.464 | 0.143 | |
| body mass~ | |||||
| Ancestry | -0.326 | 0.232 | -1.403 | 0.161 | |
| Rainfall | 0.093 | 0.107 | 0.869 | 0.385 | |
| Temperature | -0.832 | 0.265 | -3.141 | 0.002 | |
| Humidity | 0.406 | 0.297 | 1.364 | 0.173 |
Discussion
Our study provides insight into how the frequency yellow-fronted and red-fronted tinkerbird song is influenced by temperature, via the effect of temperature on body size in line with Bergmann’s rule. We also observed a significant positive impact of humidity on song frequency. The opposing effects of temperature and humidity on song frequency indicate that the song of tinkerbirds is strongly influenced by environmental factors. For instance, tinkerbirds living in warmer climates tend to have smaller body sizes, resulting in higher frequency songs, in accordance with Bergmann’s rule.
Additionally, we identified a negative relationship between ancestry and song frequency. This indicates that birds with a higher proportion of red-fronted tinkerbird ancestry sing at lower frequencies. Furthermore, the significant negative association between song frequency and EVI (a measure of greenness) suggests that birds found in dense coastal forests, such as the red-fronted tinkerbird, sing at lower frequencies. This aligns with the acoustic adaptation hypothesis, suggesting that for effective propagation of vocal signals, birds should adjust their songs based on their environment. Therefore, our results demonstrate that, for optimal song transmission, red-fronted tinkerbirds in coastal forests should sing at lower frequencies, contrary to yellow-fronted tinkerbirds in open habitats.
References
Ashton, K. G. (2002). Patterns of within‐species body size variation of birds: strong evidence for Bergmann’s rule. Global Ecology and Biogeography: A Journal of Macroecology, 11(6), 505–523. https://doi.org/10.1046/j.1466-822x.2002.00313.x
Badyaev, A. V., Hill, G. E., & Weckwort, B. V. (2002). Species divergence in sexually selected traits: increase in song elaboration is related to decrease in plumage ornamentation in finches. Evolution; International Journal of Organic Evolution, 56(2), 412–419. https://doi.org/10.1111/j.0014-3820.2002.tb01350.x
Ballentine, B. (2006). Morphological adaptation influences the evolution of a mating signal. Evolution; International Journal of Organic Evolution, 60(9), 1936–1944. https://doi.org/10.1111/j.0014-3820.2006.tb00536.x
Blount, J. D., Metcalfe, N. B., Birkhead, T. R., & Surai, P. F. (2003). Carotenoid modulation of immune function and sexual attractiveness in zebra finches. Science, 300(5616), 125–127. https://doi.org/10.1126/science.1082142
Brumm, H., & Naguib, M. (2009). Chapter 1 Environmental Acoustics and the Evolution of Bird Song. In Advances in the Study of Behavior (Vol. 40, pp. 1–33). Academic Press. https://doi.org/10.1016/S0065-3454(09)40001-9
Catchpole, C. K., & Slater, P. J. B. (2003). Bird Song: Biological Themes and Variations. Cambridge University Press. https://play.google.com/store/books/details?id=sB24pLg4gywC
Cooney, C. R., He, Y., Varley, Z. K., Nouri, L. O., Moody, C. J. A., Jardine, M. D., Liker, A., Székely, T., & Thomas, G. H. (2022). Latitudinal gradients in avian colourfulness. Nature Ecology & Evolution, 6(5), 622–629. https://doi.org/10.1038/s41559-022-01714-1
Delhey, K., Szecsenyi, B., Nakagawa, S., & Peters, A. (2017). Conspicuous plumage colours are highly variable. Proceedings. Biological Sciences / The Royal Society, 284(1847). https://doi.org/10.1098/rspb.2016.2593
Delhey, K., Valcu, M., Dale, J., & Kempenaers, B. (2023). The evolution of carotenoid-based plumage colours in passerine birds. The Journal of Animal Ecology, 92(1), 66–77. https://doi.org/10.1111/1365-2656.13791
Derryberry, E. P., Seddon, N., Derryberry, G. E., Claramunt, S., Seeholzer, G. F., Brumfield, R. T., & Tobias, J. A. (2018). Ecological drivers of song evolution in birds: Disentangling the effects of habitat and morphology. Ecology and Evolution, 8(3), 1890–1905. https://doi.org/10.1002/ece3.3760
Ey, E., & Fischer, J. (2009). THE ‘Acoustic Adaptation Hypothesis’—A Review of the Evidence from Birds, Anurans and Mammals. Bioacoustics, 19(1-2), 21–48. https://doi.org/10.1080/09524622.2009.9753613
Fick, S. E., & Hijmans, R. J. (2017). WorldClim 2: new 1‐km spatial resolution climate surfaces for global land areas. International Journal of Climatology, 37(12), 4302–4315. https://doi.org/10.1002/joc.5086
Garcia, M., & Favaro, L. (2017). Animal vocal communication: function, structures, and production mechanisms. Current Zoology, 63(4), 417–419. https://doi.org/10.1093/cz/zox040
Giuseppe Boncoraglio, & Saino, N. (2007). Habitat Structure and the Evolution of Bird Song: A Meta-Analysis of the Evidence for the Acoustic Adaptation Hypothesis. Functional Ecology, 21(1), 134–142. http://www.jstor.org/stable/4139395
Hill, G. E. (2002). A Red Bird in a Brown Bag: The Function and Evolution of Colorful Plumage in the House Finch. Oxford University Press. https://play.google.com/store/books/details?id=NcXQCwAAQBAJ
Hill, G. E., Weaver, R. J., & Powers, M. J. (2023). Carotenoid ornaments and the spandrels of physiology: a critique of theory to explain condition dependency. Biological Reviews of the Cambridge Philosophical Society, 98(6), 2320–2332. https://doi.org/10.1111/brv.13008
Hoese, W. J., Podos, J., Boetticher, N. C., & Nowicki, S. (2000). Vocal tract function in birdsong production: experimental manipulation of beak movements. The Journal of Experimental Biology, 203(Pt 12), 1845–1855. https://doi.org/10.1242/jeb.203.12.1845
Isaksson, C., Von Post, M., & Andersson, S. (2007). Sexual, seasonal, and environmental variation in plasma carotenoids in great tits, Parus major: Variation in plasma carotenoids in great tits. Biological Journal of the Linnean Society. Linnean Society of London, 92(3), 521–527. https://doi.org/10.1111/j.1095-8312.2007.00852.x
Kirschel, A. N. G., Blumstein, D. T., & Smith, T. B. (2009). Character displacement of song and morphology in African tinkerbirds. Proceedings of the National Academy of Sciences of the United States of America, 106(20), 8256–8261. https://doi.org/10.1073/pnas.0810124106
Kirschel, A. N. G., Nwankwo, E. C., Pierce, D. K., Lukhele, S. M., Moysi, M., Ogolowa, B. O., Hayes, S. C., Monadjem, A., & Brelsford, A. (2020). CYP2J19 mediates carotenoid colour introgression across a natural avian hybrid zone. Molecular Ecology, 29(24), 4970–4984. https://doi.org/10.1111/mec.15691
Krebs, J., Ashcroft, R., & Webber, M. (1978). Song repertoires and territory defence in the great tit. Nature, 271(5645), 539–542. https://doi.org/10.1038/271539a0
Lopes, R. J., Johnson, J. D., Toomey, M. B., Ferreira, M. S., Araujo, P. M., Melo-Ferreira, J., Andersson, L., Hill, G. E., Corbo, J. C., & Carneiro, M. (2016). Genetic basis for red coloration in birds. Current Biology: CB, 26(11), 1427–1434. https://doi.org/10.1016/j.cub.2016.03.076
Lozano, G. A. (1994). Carotenoids, Parasites, and Sexual Selection. Oikos , 70(2), 309–311. https://doi.org/10.2307/3545643
Mason, N. A., & Bowie, R. C. K. (2020). Plumage patterns: Ecological functions, evolutionary origins, and advances in quantification. The Auk, 137(4), ukaa060. https://doi.org/10.1093/auk/ukaa060
Mason, N. A., Burns, K. J., Tobias, J. A., Claramunt, S., Seddon, N., & Derryberry, E. P. (2017). Song evolution, speciation, and vocal learning in passerine birds. Evolution; International Journal of Organic Evolution, 71(3), 786–796. https://doi.org/10.1111/evo.13159
Mason, N. A., Shultz, A. J., & Burns, K. J. (2014). Elaborate visual and acoustic signals evolve independently in a large, phenotypically diverse radiation of songbirds. Proceedings. Biological Sciences, 281(1788), 20140967. https://doi.org/10.1098/rspb.2014.0967
McGraw, K. J., & Hill, G. E. (2000). Carotenoid-based ornamentation and status signaling in the house finch. Behavioral Ecology: Official Journal of the International Society for Behavioral Ecology, 11(5), 520–527. https://doi.org/10.1093/beheco/11.5.520
Mikula, P., Valcu, M., Brumm, H., Bulla, M., Forstmeier, W., Petrusková, T., Kempenaers, B., & Albrecht, T. (2021). A global analysis of song frequency in passerines provides no support for the acoustic adaptation hypothesis but suggests a role for sexual selection. Ecology Letters, 24(3), 477–486. https://doi.org/10.1111/ele.13662
Mundy, N. I., Stapley, J., Bennison, C., Tucker, R., Twyman, H., Kim, K.-W., Burke, T., Birkhead, T. R., Andersson, S., & Slate, J. (2016). Red Carotenoid Coloration in the Zebra Finch Is Controlled by a Cytochrome P450 Gene Cluster. Current Biology: CB, 26(11), 1435–1440. https://doi.org/10.1016/j.cub.2016.04.047
Nowicki, S. (1987). Vocal tract resonances in oscine bird sound production: evidence from birdsongs in a helium atmosphere. Nature, 325(6099), 53–55. https://doi.org/10.1038/325053a0
Nwankwo, E. C., Mortega, K. G., Karageorgos, A., Ogolowa, O. B., Papagregoriou, G., Grether, G. F., Monadjem, A., & Kirschel, A. N. G. (2019). Rampant introgressive hybridization in Pogoniulus tinkerbirds (Piciformes: Lybiidae) despite millions of years of divergence. Biological Journal of the Linnean Society. Linnean Society of London. https://academic.oup.com/biolinnean/article-abstract/127/1/125/5426436
Nwankwo, E. C., Pallari, C. T., Hadjioannou, L., Ioannou, A., Mulwa, R. K., & Kirschel, A. N. G. (2018). Rapid song divergence leads to discordance between genetic distance and phenotypic characters important in reproductive isolation. Ecology and Evolution, 8(1), 716–731. https://doi.org/10.1002/ece3.3673
Osorio, D., & Vorobyev, M. (2008). A review of the evolution of animal colour vision and visual communication signals. Vision Research, 48(20), 2042–2051. https://doi.org/10.1016/j.visres.2008.06.018
Parker, R. S. (1996). Absorption, metabolism, and transport of carotenoids. FASEB Journal: Official Publication of the Federation of American Societies for Experimental Biology, 10(5), 542–551. https://doi.org/10.1096/fasebj.10.5.8621054
Pike, T. W. (2017). Discrimination of signal carotenoid content using multidimensional chromatic information. Behavioral Ecology: Official Journal of the International Society for Behavioral Ecology, 29(1), 87–92. https://doi.org/10.1093/beheco/arx136
Podos, J. (2001). Correlated evolution of morphology and vocal signal structure in Darwin’s finches. Nature, 409(6817), 185–188. https://doi.org/10.1038/35051570
Podos, J., Sherer, J. K., Peters, S., & Nowicki, S. (1995). Ontogeny of vocal tract movements during song production in song sparrows. Animal Behaviour, 50(5), 1287–1296. https://doi.org/10.1016/0003-3472(95)80044-1
Riede, T., Suthers, R. A., Fletcher, N. H., & Blevins, W. E. (2006). Songbirds tune their vocal tract to the fundamental frequency of their song. Proceedings of the National Academy of Sciences of the United States of America, 103(14), 5543–5548. https://doi.org/10.1073/pnas.0601262103
Rosenthal, G. G., & Ryan, M. J. (2000). Visual and acoustic communication in non-human animals: a comparison. Journal of Biosciences, 25(3), 285–290. https://doi.org/10.1007/BF02703937
Saks, L., McGraw, K., & Hõrak, P. (2003). How Feather Colour Reflects Its Carotenoid Content. Functional Ecology, 17(4), 555–561. http://www.jstor.org/stable/3598994
Saks, L., Ots, I., & Hõrak, P. (2003). Carotenoid-based plumage coloration of male greenfinches reflects health and immunocompetence. Oecologia, 134(3), 301–307. https://doi.org/10.1007/s00442-002-1125-z
Salewski, V., & Watt, C. (2017). Bergmann’s rule: a biophysiological rule examined in birds. Oikos (Copenhagen, Denmark), 126(2). https://doi.org/10.1111/oik.03698
Santos, E. S. A., Scheck, D., & Nakagawa, S. (2011). Dominance and plumage traits: meta-analysis and metaregression analysis. Animal Behaviour, 82(1), 3–19. https://doi.org/10.1016/j.anbehav.2011.03.022
Schmidt, R., Amrhein, V., Kunc, H. P., & Naguib, M. (2007). The day after: effects of vocal interactions on territory defence in nightingales. The Journal of Animal Ecology, 76(1), 168–173. https://doi.org/10.1111/j.1365-2656.2006.01182.x
Sebastianelli, M., Lukhele, S. M., & Nwankwo, E. C. (2022). Continent‐wide patterns of song variation predicted by classical rules of biogeography. Ecology Letters. https://onlinelibrary.wiley.com/doi/abs/10.1111/ele.14102
Sebastianelli, M., Lukhele, S. M., Secomandi, S., de Souza, S. G., Haase, B., Moysi, M., Nikiforou, C., Hutfluss, A., Mountcastle, J., Balacco, J. R., Pelan, S., Chow, W., Fedrigo, O., Downs, C. T., Monadjem, A., Dingemanse, N., Jarvis, E. D., Brelsford, A., Vonholdt, B., & Kirschel, A. N. G. (2024). A genomic basis of vocal rhythm in birds. Nature Communications, 15. https://doi.org/10.1038/s41467-024-47305-5
Short, L., & Horne, J. F. M. (2001). Toucans, Barbets, and Honeyguides: Ramphastidae, Capitonidae and Indicatoridae. OUP Oxford. https://play.google.com/store/books/details?id=EMEKaTlR3qcC
Simons, M. J. P., Maia, R., Leenknegt, B., & Verhulst, S. (2014). Carotenoid-dependent signals and the evolution of plasma carotenoid levels in birds. The American Naturalist, 184(6), 741–751. https://doi.org/10.1086/678402
Slabbekoorn, H., & Smith, T. B. (2002). Bird song, ecology and speciation. Philosophical Transactions of the Royal Society of London. Series B, Biological Sciences, 357(1420), 493–503. https://doi.org/10.1098/rstb.2001.1056
Suthers, R. A., & Zollinger, S. A. (2004). Producing song: the vocal apparatus. Annals of the New York Academy of Sciences, 1016, 109–129. https://doi.org/10.1196/annals.1298.041
ten Cate, C. (2021). Re-evaluating vocal production learning in non-oscine birds. Philosophical Transactions of the Royal Society of London. Series B, Biological Sciences, 376(1836), 20200249. https://doi.org/10.1098/rstb.2020.0249
Teplitsky, C., Mills, J. A., Alho, J. S., Yarrall, J. W., & Merilä, J. (2008). Bergmann’s rule and climate change revisited: disentangling environmental and genetic responses in a wild bird population. Proceedings of the National Academy of Sciences of the United States of America, 105(36), 13492–13496. https://doi.org/10.1073/pnas.0800999105
Twyman, H., Andersson, S., & Mundy, N. I. (2018). Evolution of CYP2J19, a gene involved in colour vision and red coloration in birds: positive selection in the face of conservation and pleiotropy. BMC Evolutionary Biology, 18(1), 22. https://doi.org/10.1186/s12862-018-1136-y
Weaver, R. J., Santos, E. S. A., Tucker, A. M., Wilson, A. E., & Hill, G. E. (2018). Carotenoid metabolism strengthens the link between feather coloration and individual quality. Nature Communications, 9(1), 73. https://doi.org/10.1038/s41467-017-02649-z
Willink, B., & Wu, M. Y. (2023). To colour a bird: The evolution of carotenoid-based colouration in passerines is shaped by sexual selection, ecology and life history. The Journal of Animal Ecology, 92(1), 4–6. https://doi.org/10.1111/1365-2656.13840
Zhang, X., & Savalei, V. (2016). Bootstrapping Confidence Intervals for Fit Indexes in Structural Equation Modeling. Structural Equation Modeling: A Multidisciplinary Journal, 23(3), 392–408. https://doi.org/10.1080/10705511.2015.1118692
Zhang, Y., Xiao, X., Wu, X., Zhou, S., Zhang, G., Qin, Y., & Dong, J. (2017). A global moderate resolution dataset of gross primary production of vegetation for 2000-2016. Scientific Data, 4, 170165. https://doi.org/10.1038/sdata.2017.165